-Stats
Statistics for the cluster are shown in two views, a treemap graph view and a tabular view. Each view may be toggled to switch between totals by k8s resource kind and k8s namespace.
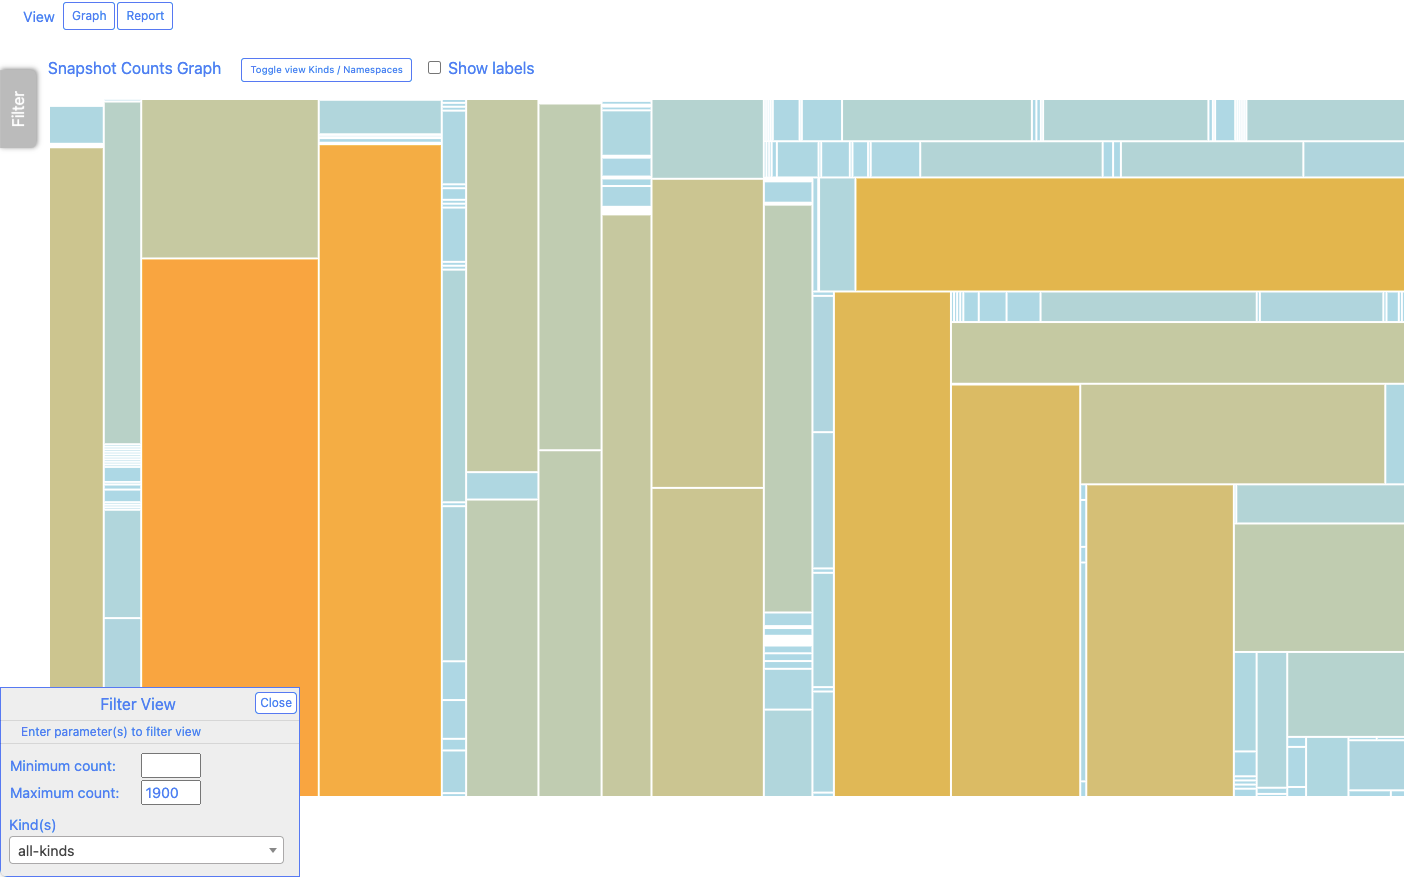
Graph view
The treemap graph displays data by color rectangles. The size and color of the rectangle provides a graphic view of the count associated with that rectangle.
Since a treemap graph can become very dense and messy the ability to show or hide the labels associated with each rectangle is provided. Also, data can be filtered by minimum amount, maximum amount, and either kind or namespace.
Mouse over any rectangle to view summary information. Click any rectangle to view the associated data in the Search tab. If the Namespace view is toggled the Search will also filter for the associated namespace.
Use the button labeled Toggle view for Kind / Namespace to toggle the view.
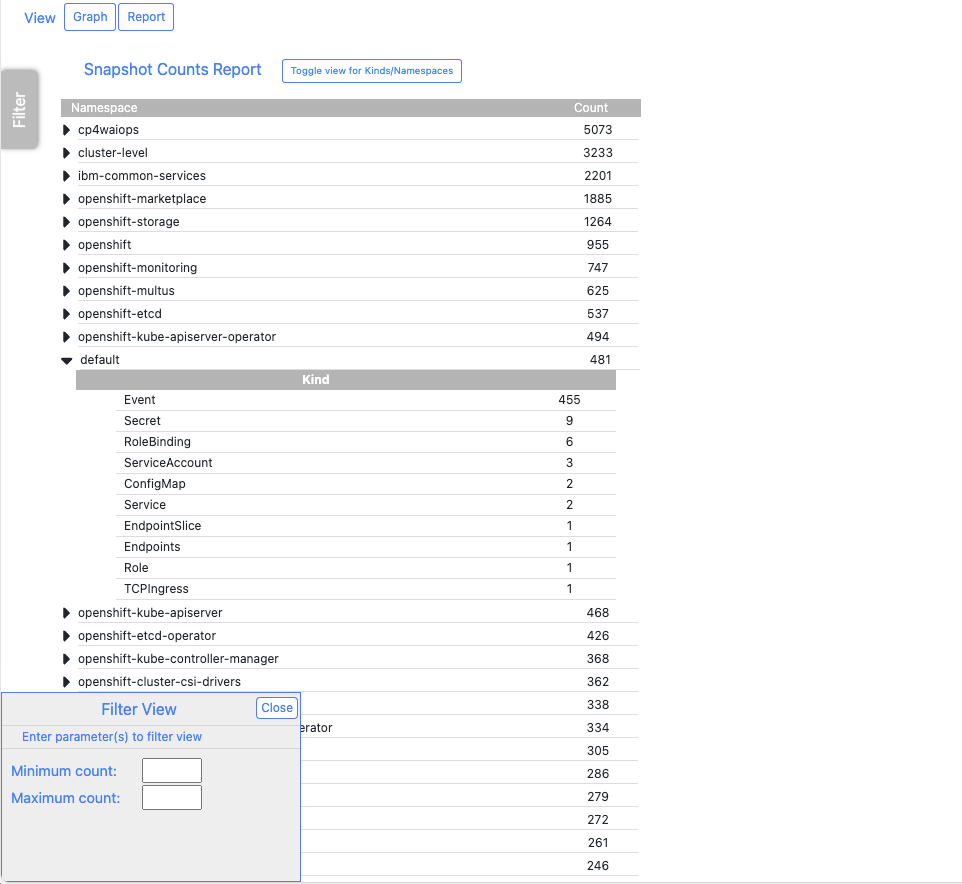
Report view
The report view is a tabular view of the data with collapsible sections. Click the small black triangles to toggle the collapsed sections.
Clicking any of the lines of the table report will open the Search tab with the associated data shown in the search results table.
Filtering for the Report view only supports providing a minimum count and maximum count and does not support namespace filtering.
Use the button labeled Toggle view for Kind / Namespace to toggle the views.