-Event Msgs
This tab provides statistics regarding event messages and two views. Once view is a timeline and the other view is tabular view.
There are three buttons, a drop down for Namespace, along with a input field for the first minute to display. Use the buttons to select the desired view and the drop down and input field to filter what is shown.
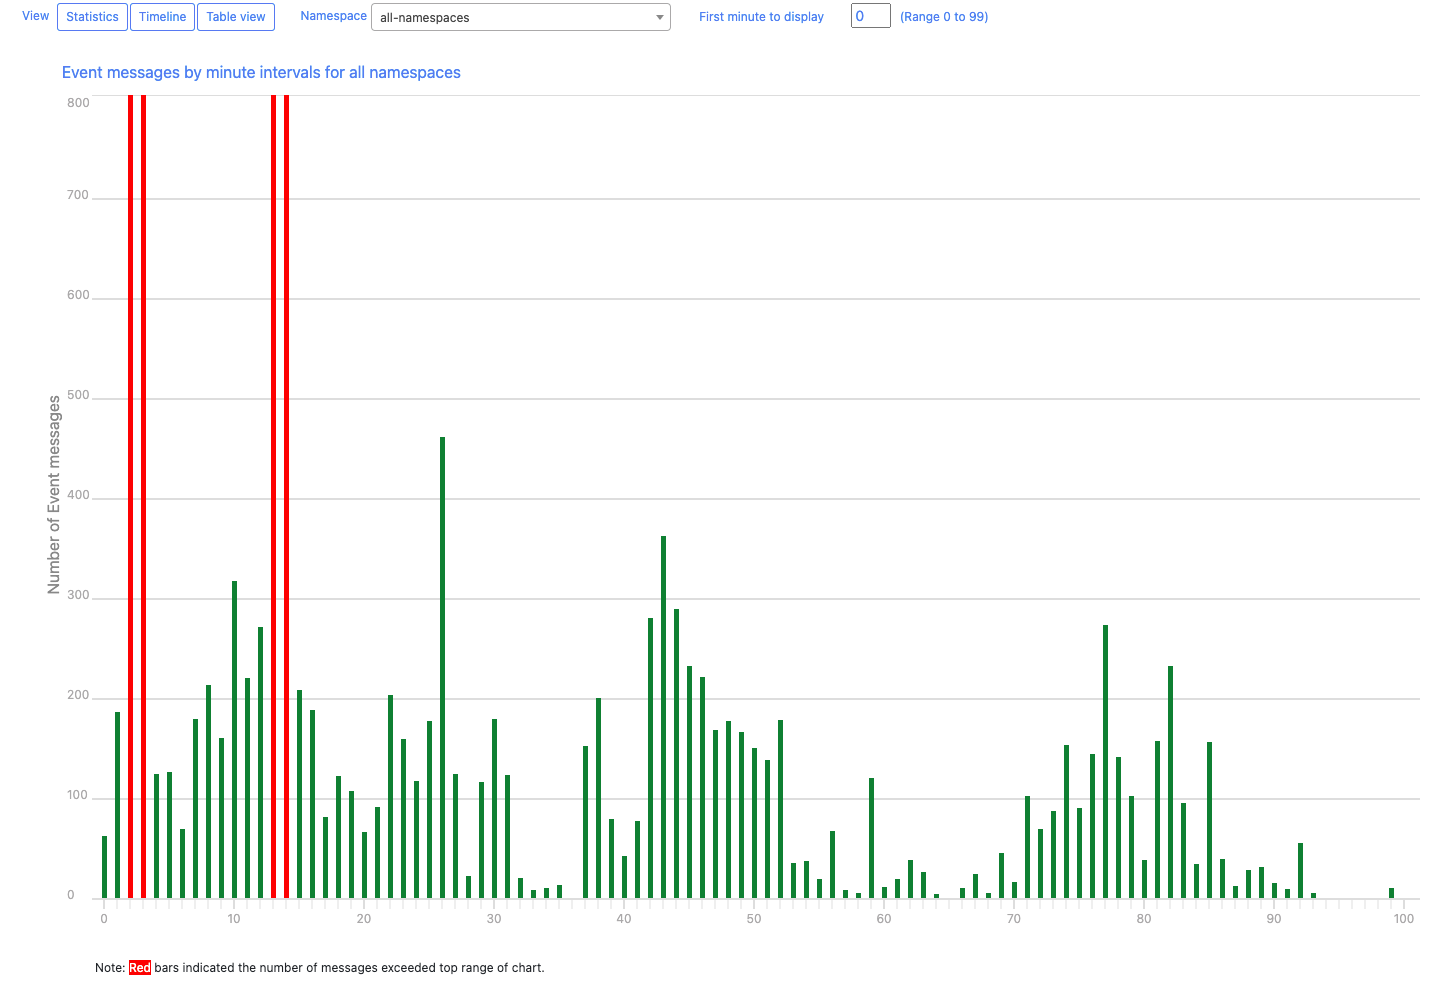
Statistics view
This view is a bar chart graph with the volume of messages shown by each minute. The left axis is the count of messages. If more than 800 messages occurred in the associated minute the bar will be shown in the color red. Otherwise, the bar will be shown in green.
The bottom axis is the minute when the messages occur.
Mouse over any bar to view the total message count and the associated minute.
Timeline view
This view is scrollable with collapsed sections. Each collapsed section is preceded with a small black triangle. Click the triangle to toggle open the collapsed view. Click the triangle a second time to close the section. Each line in this view is shown with a green rectangle that represents the time the event occurred. Mouse over the small green rectangles to view summary information. Click the title or the small green rectangle to view the resource detail.
There are also buttons at the top of the data to page the data. The current page and the total pages are shown. Press the forward and back buttons to move through the event data.
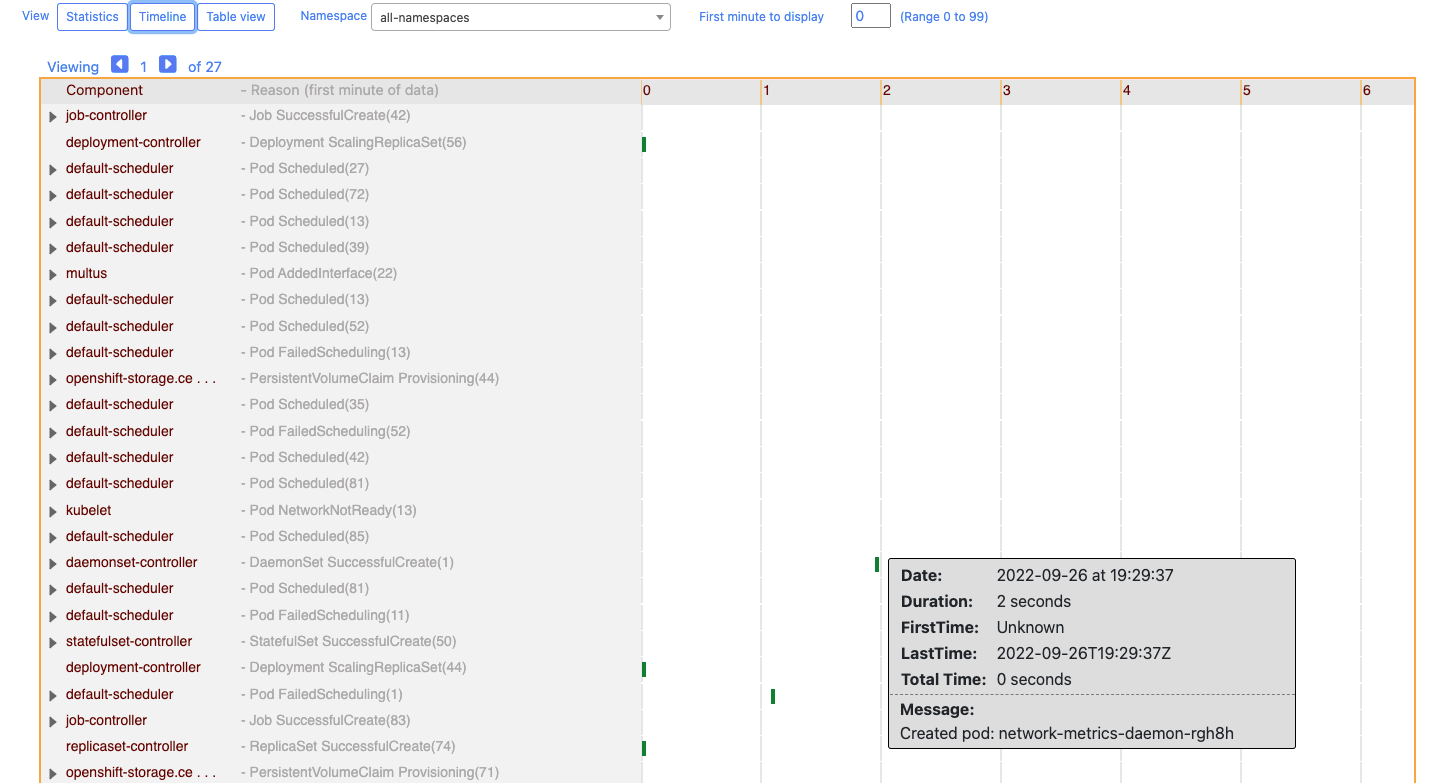
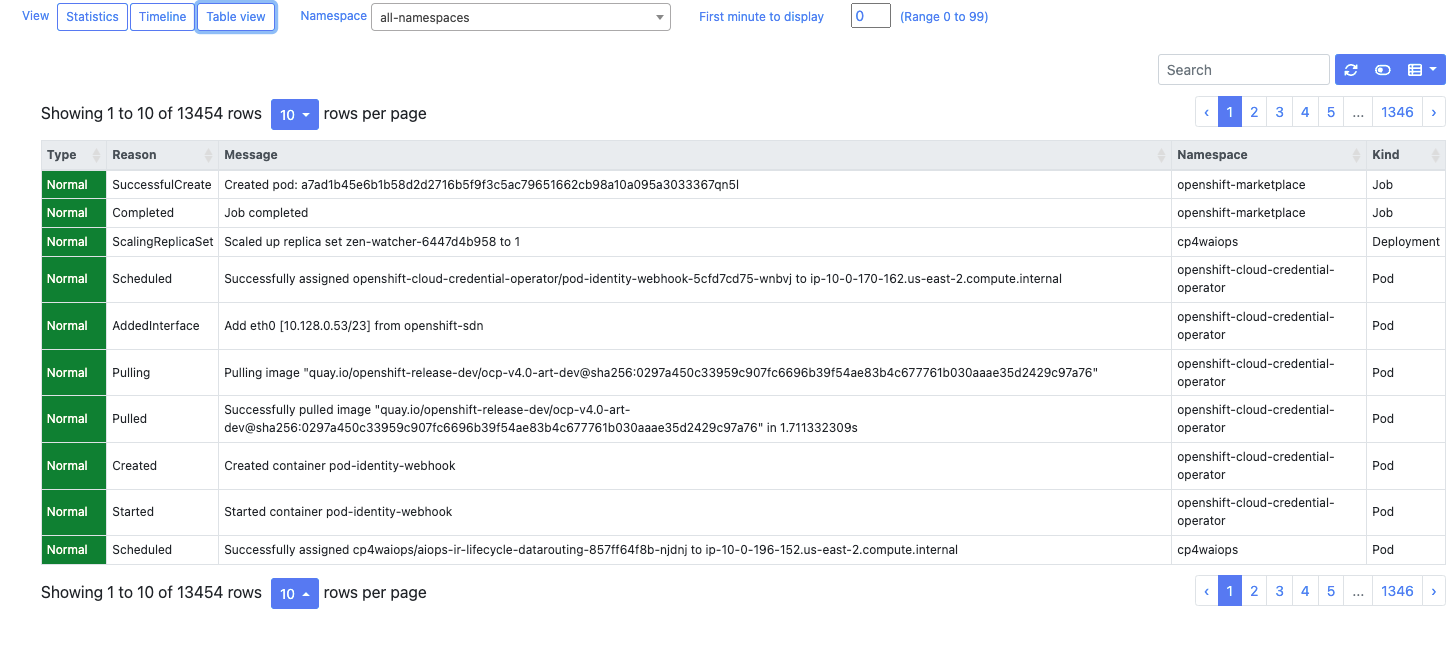
Table view
A table view of all Event messages that were available in the K8s cluster when the Snapshot was created. The first column is shown with either green, yellow, or red background. These colors represent Normal, Warning, or Failed messages respectively.
Use the standard table Search field to filter the messages that are shown. Use the other table buttons to hide or show additional columns of data.
Clicking on a message will either display the resource detail or provide a message prompt. This prompt is shown when a workload schematic can be shown for the respective message.
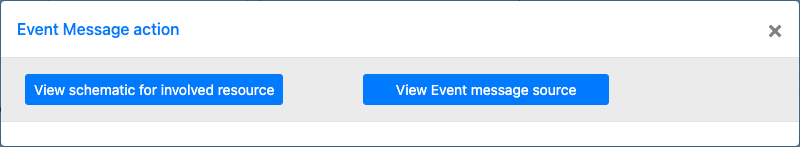
Prompt message
The following is the prompt message that is shown if the event message is associated with a schematic view.
If the 'View schematic for involved resource' button is pressed the view will switch to the Workload Schematic tab and display the associated schematic. On the Workload Schematic tab above the schematic will be a 'Return' button. Press this to return to the ‘Event Msgs’ tab.