-Cluster
Cluster tab provides a high-level 3D view of the cluster. The 3D view is interactive and can be rotated, tilted, zoomed in or out, and filtered.
The left-hand side of the screen has a slide out that enables filtering the 3D view, control sound, and save the current filter settings as the default.
The right-hand side of the screen has a slide out that provides Properties for any item in the 3D view that is clicked/selected. Once an item is selected it is high-lighted with a red circle plane shown. There is a maximum of only one red circle shown at any time.
Along with the interactive 3D view this tab also provides a timelapse of the 3D view as changes occur in the cluster.
Cluster 3D view
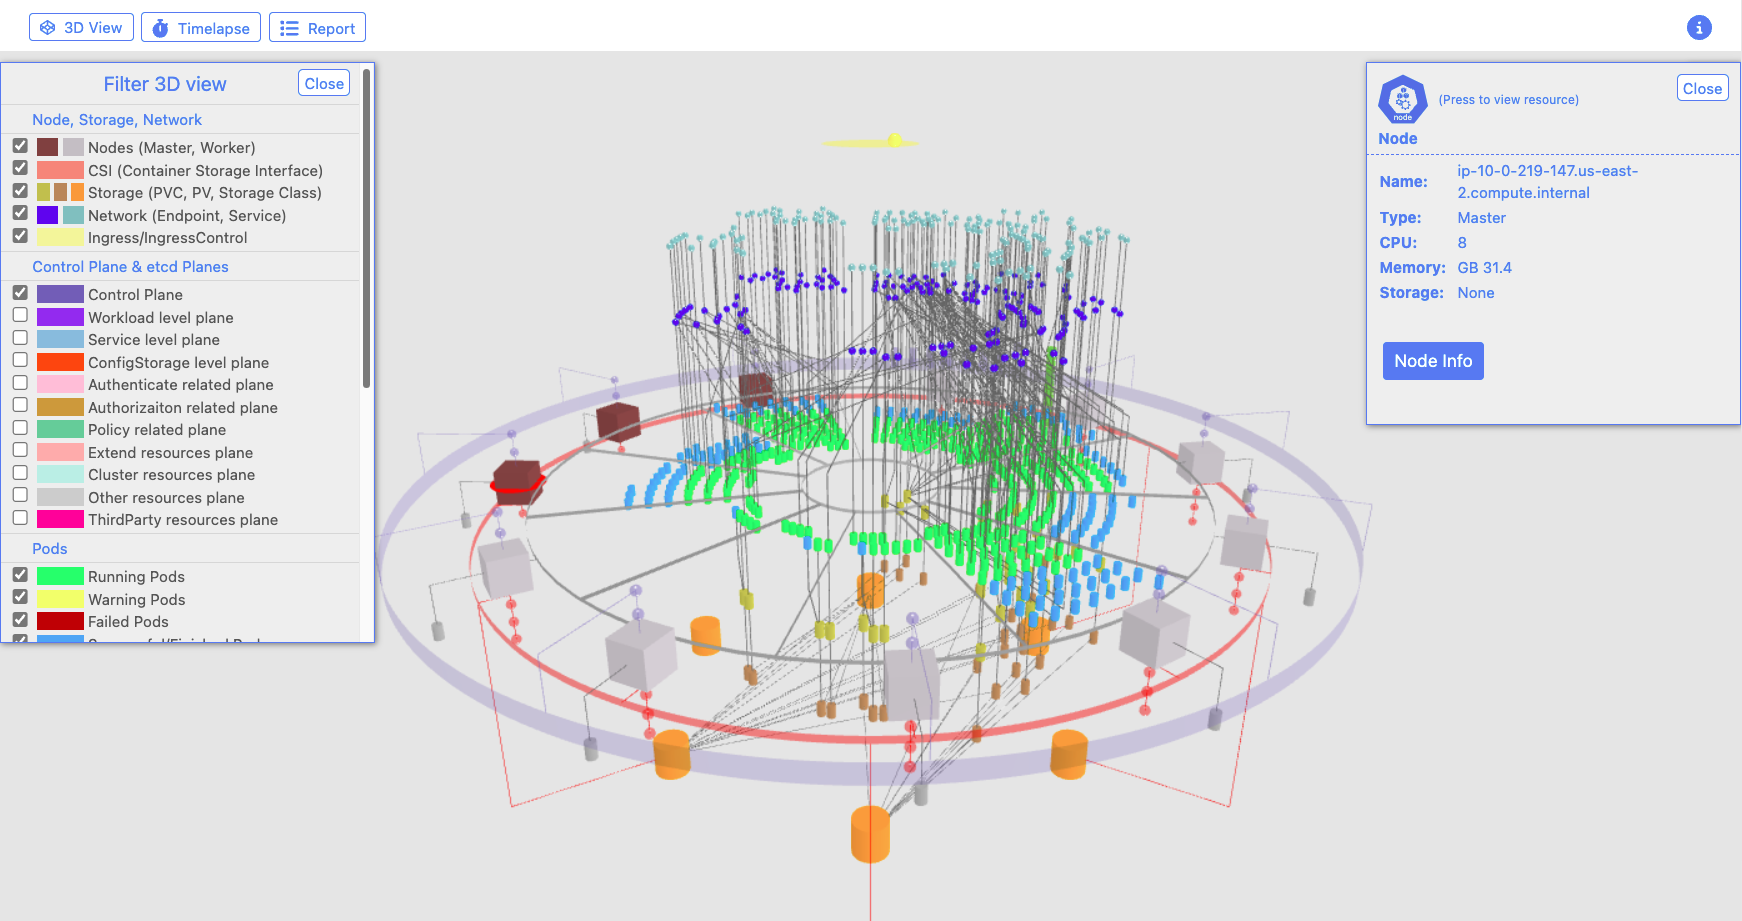
Resource properties
As k8s resource items are selected in the 3D view the properties slide-out will change based on the selected k8s resource.
Several of the resource properties provide the ability to drill down and view detail in the related tab with the context for the
tab set to match the selected resource.
Examples of the resource property drill downs are shown below.
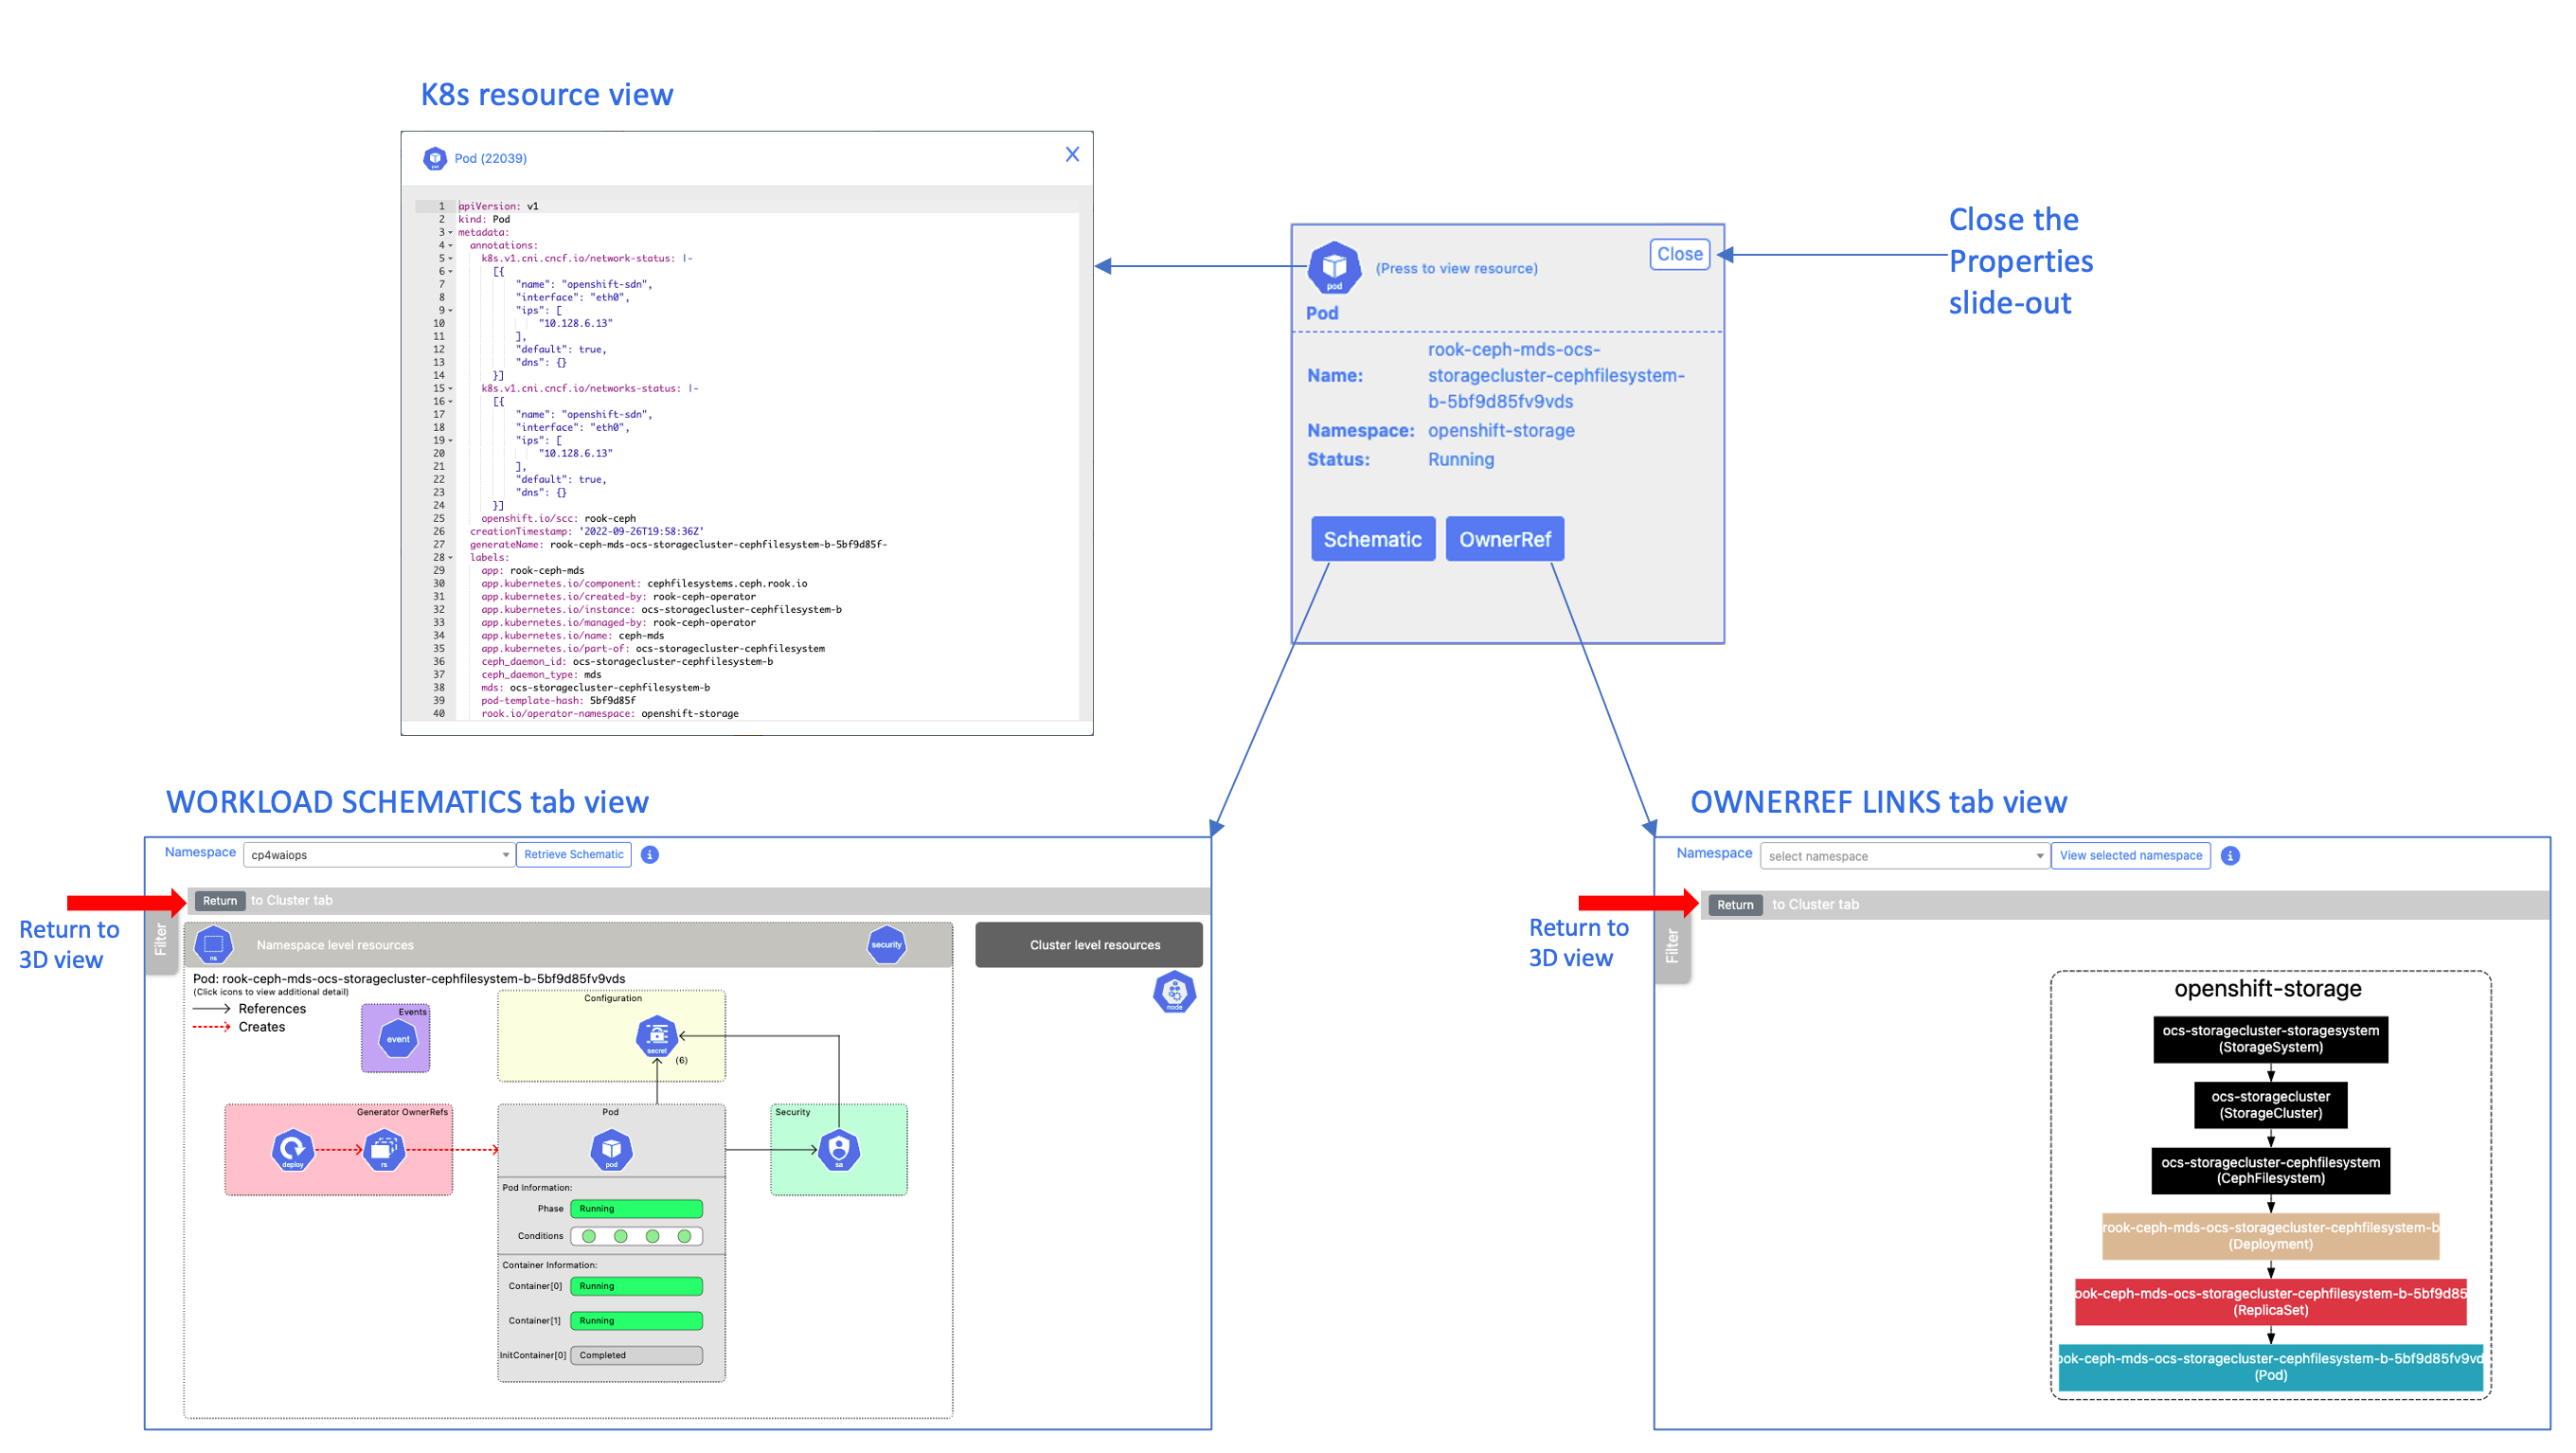
Pod - drill down
This property supports viewing the Schematic and OwnerRef tabs for the selected Pod. Click on either of the buttons to drill down and view the associated information. Once the tab is opened a button is shown in the tab to return to this tab.
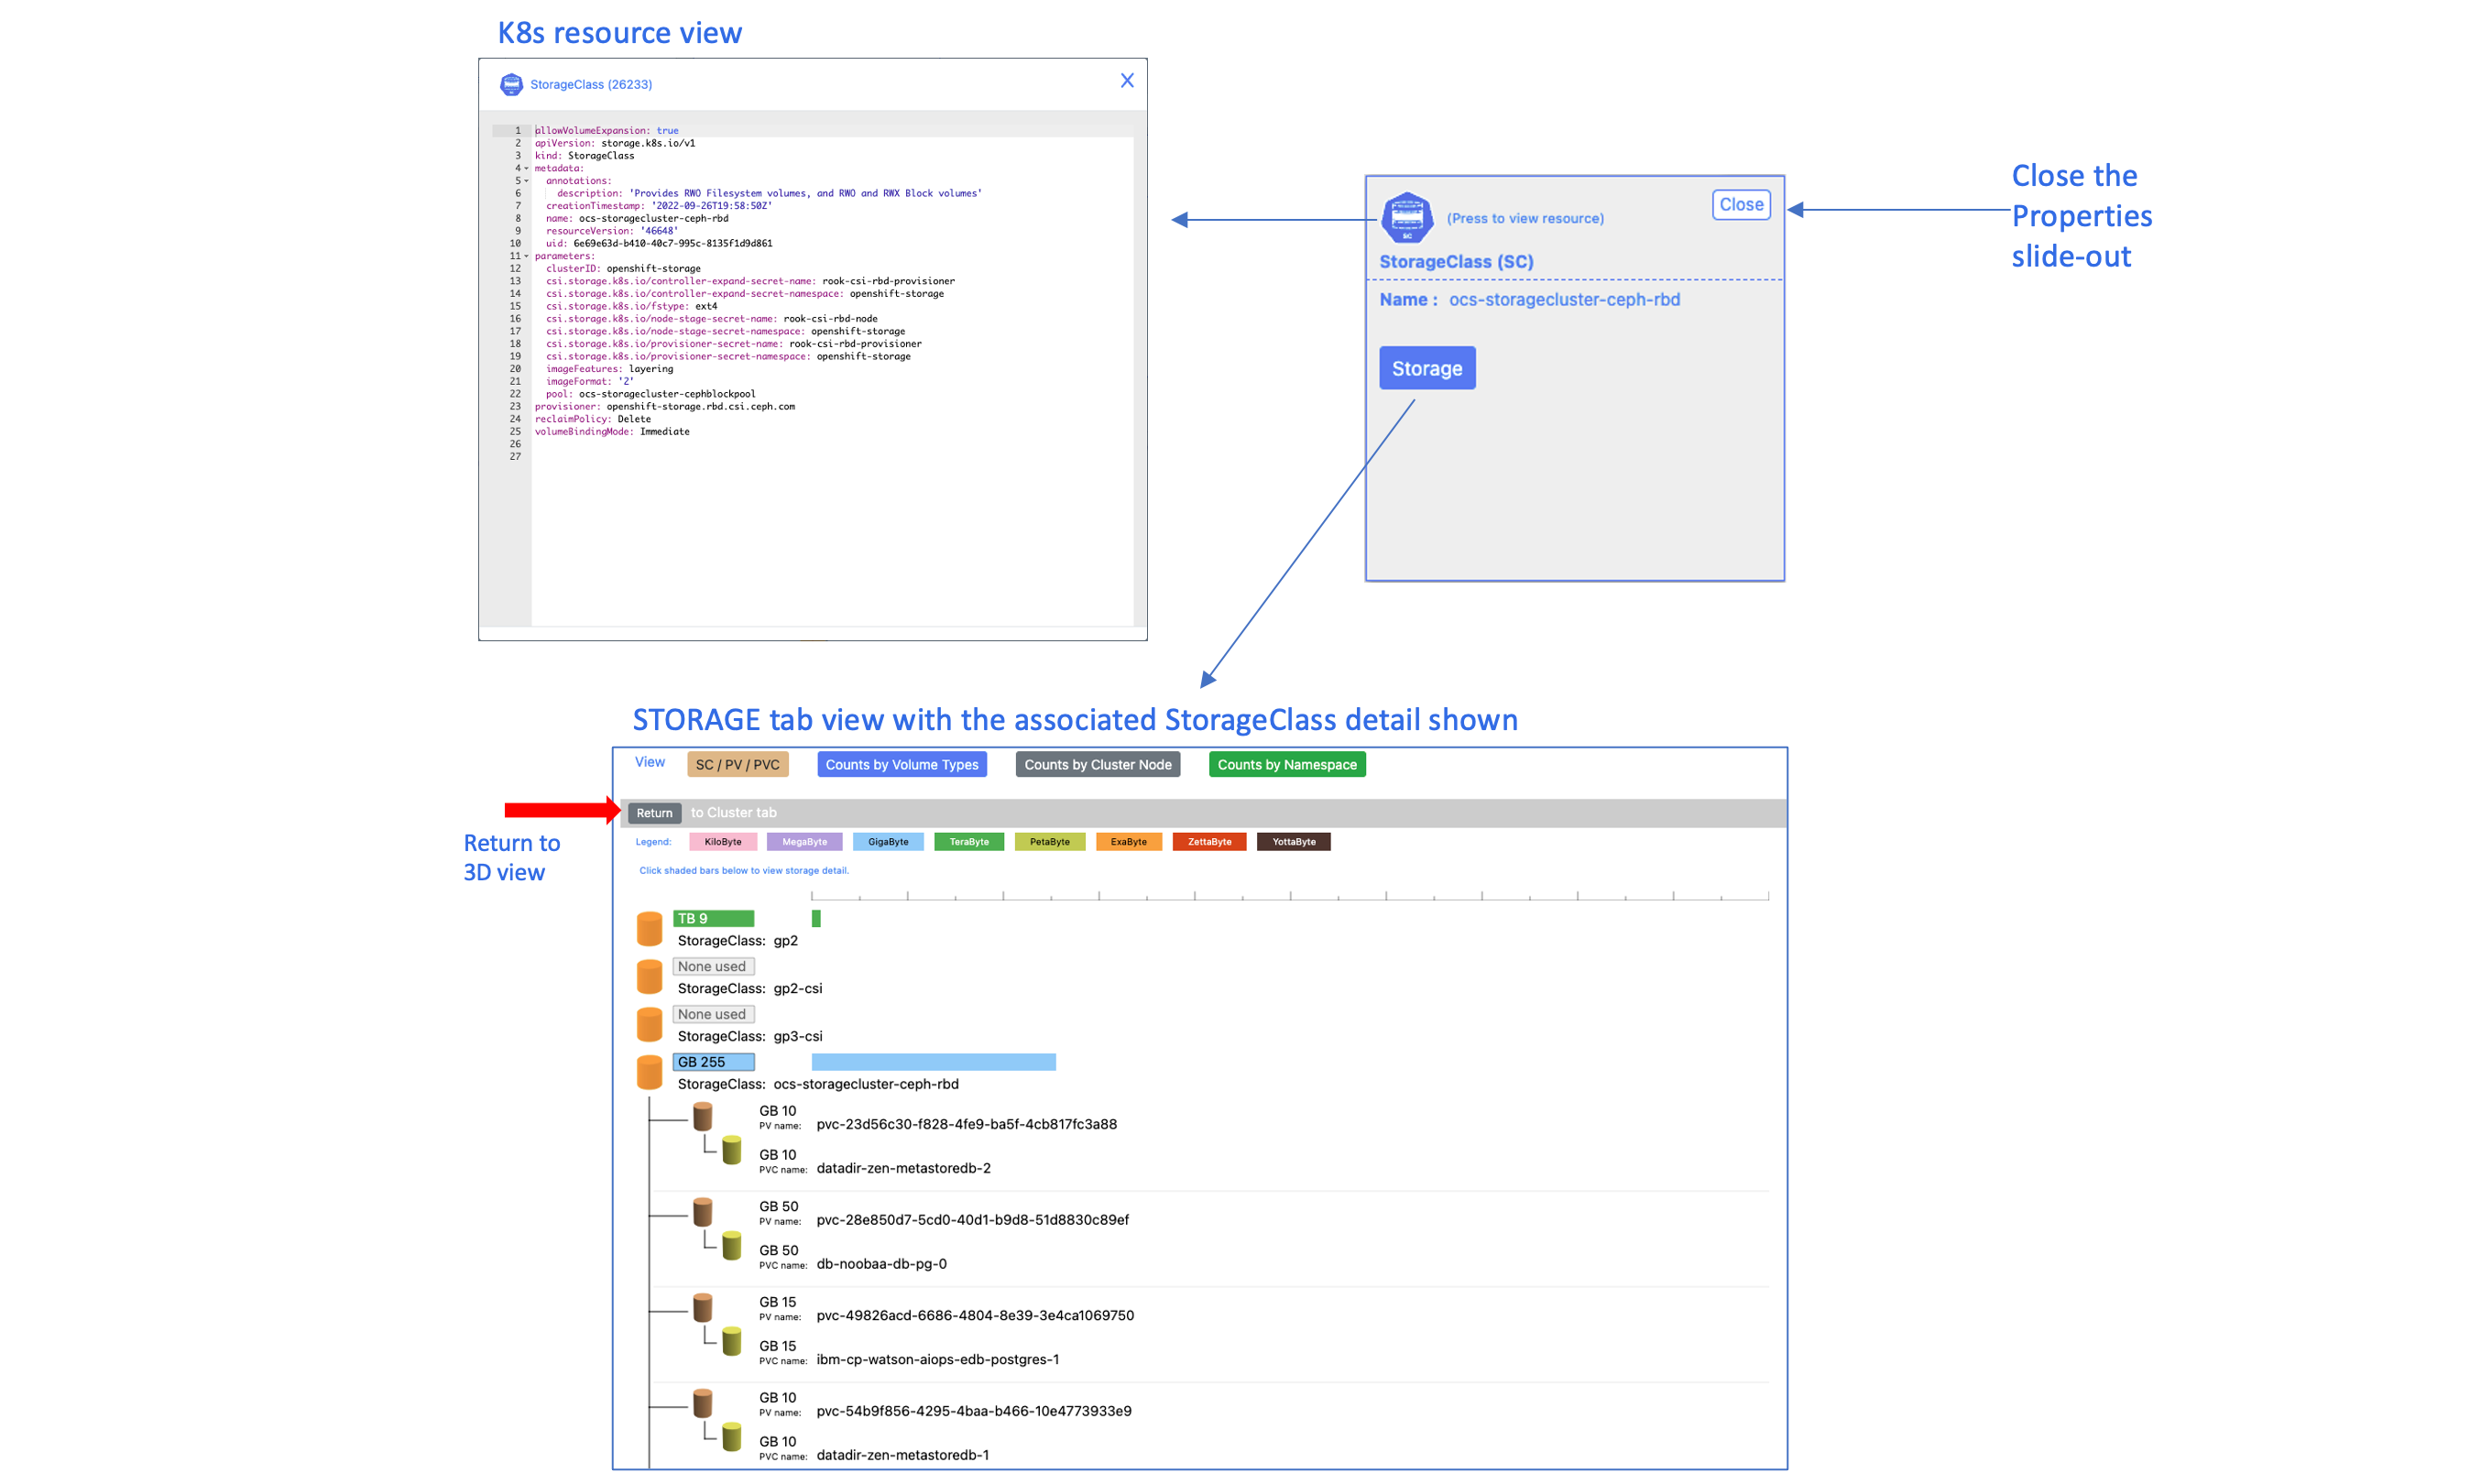
StorageClass - drill down
This property supports viewing the Storage tab for the selected StorageClass. Click on the button to drill down and view the associated information. Once the tab is opened a button is shown in the tab to return to this tab.
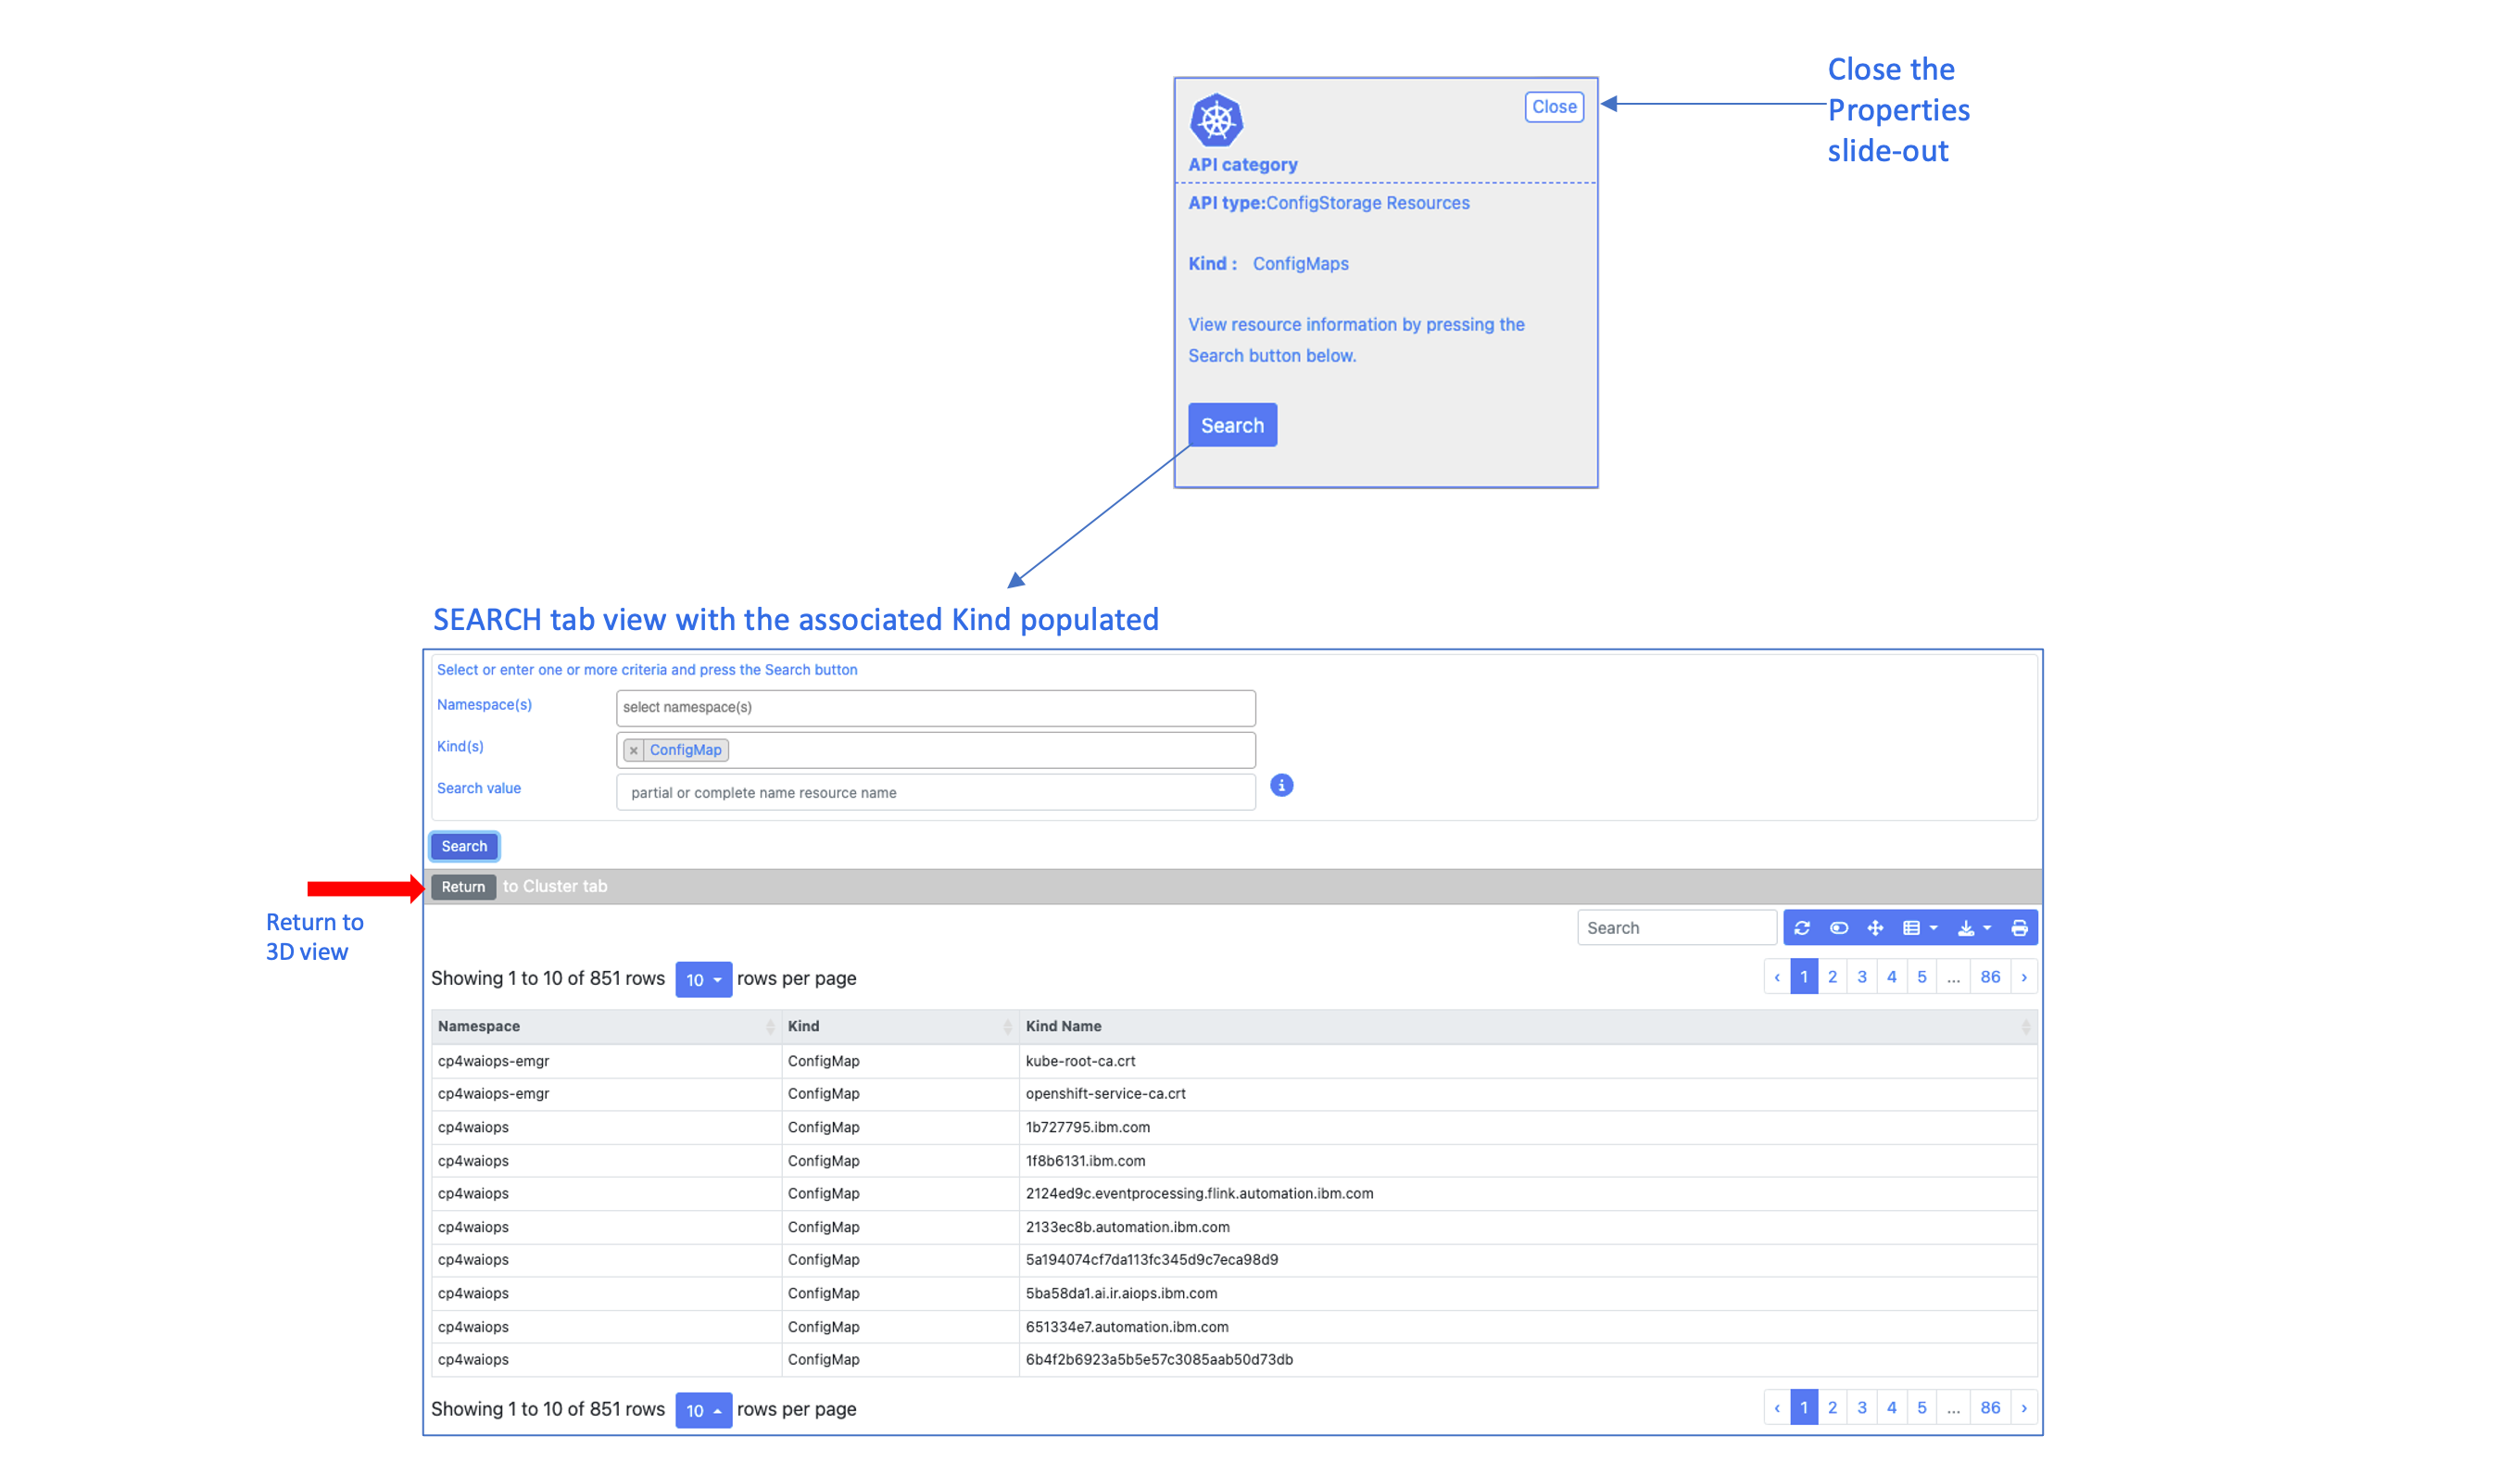
API category - drill down
This property supports viewing the Search tab for the selected API category. Click on the button to drill down and view the associated information. The Search tab is populated with the parameters and the results of searching for the selected API category. Once the tab is opened a button is shown in the tab to return to this tab.
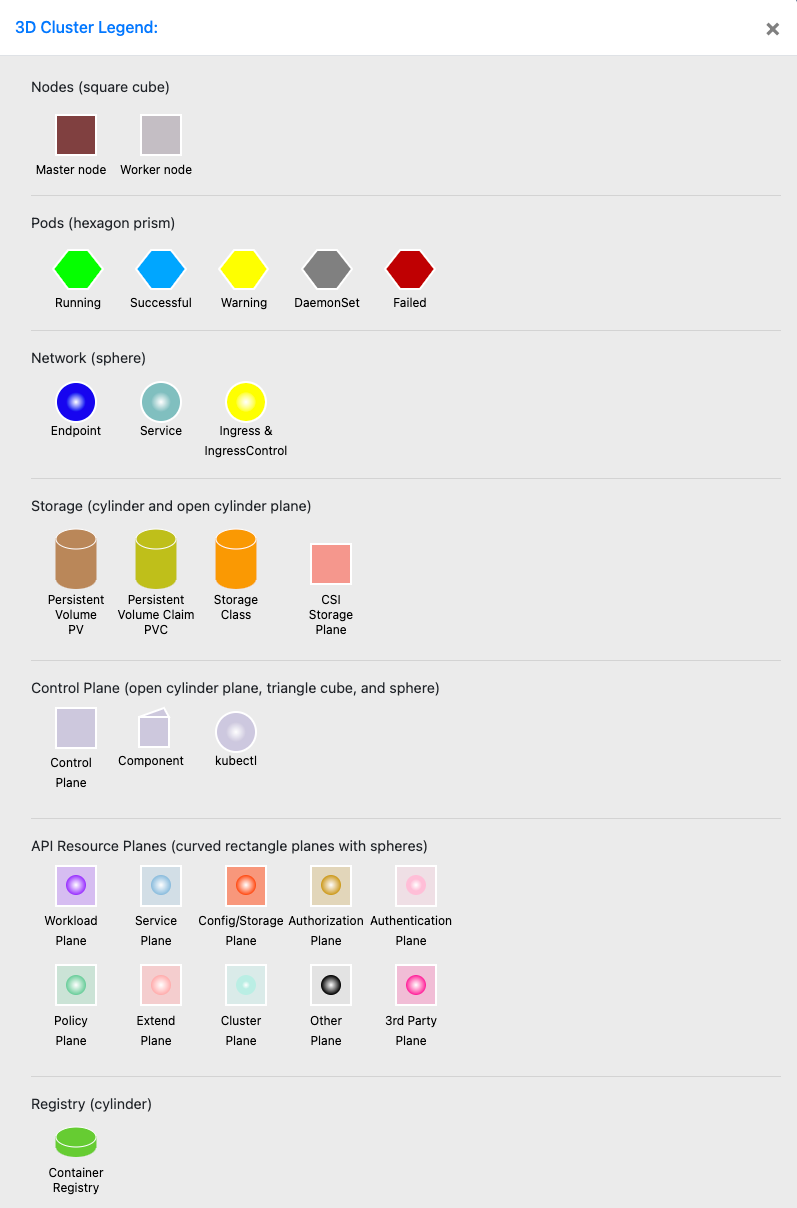
Cluster Legend
The blue circle button with and 'i' provides information related to the displayed icons and planes.
Timelapse button
In the upper portion of this tab is a button labeled Timelapse. When clicked this button will clear the 3D view and open the timelapse controls. This feature will display changes to the cluster in time sequence as they occur via intervals. The duration of each interval is dynamic. The shortest duration is one second and the longest duration is based on the amount of time between the next change to occur in the cluster.
The timelapse will automatically display all snapshot collected changes for the cluster. The view can also be manually advanced or reversed with the use of the appropriate buttons shown in the control portion of the screen.
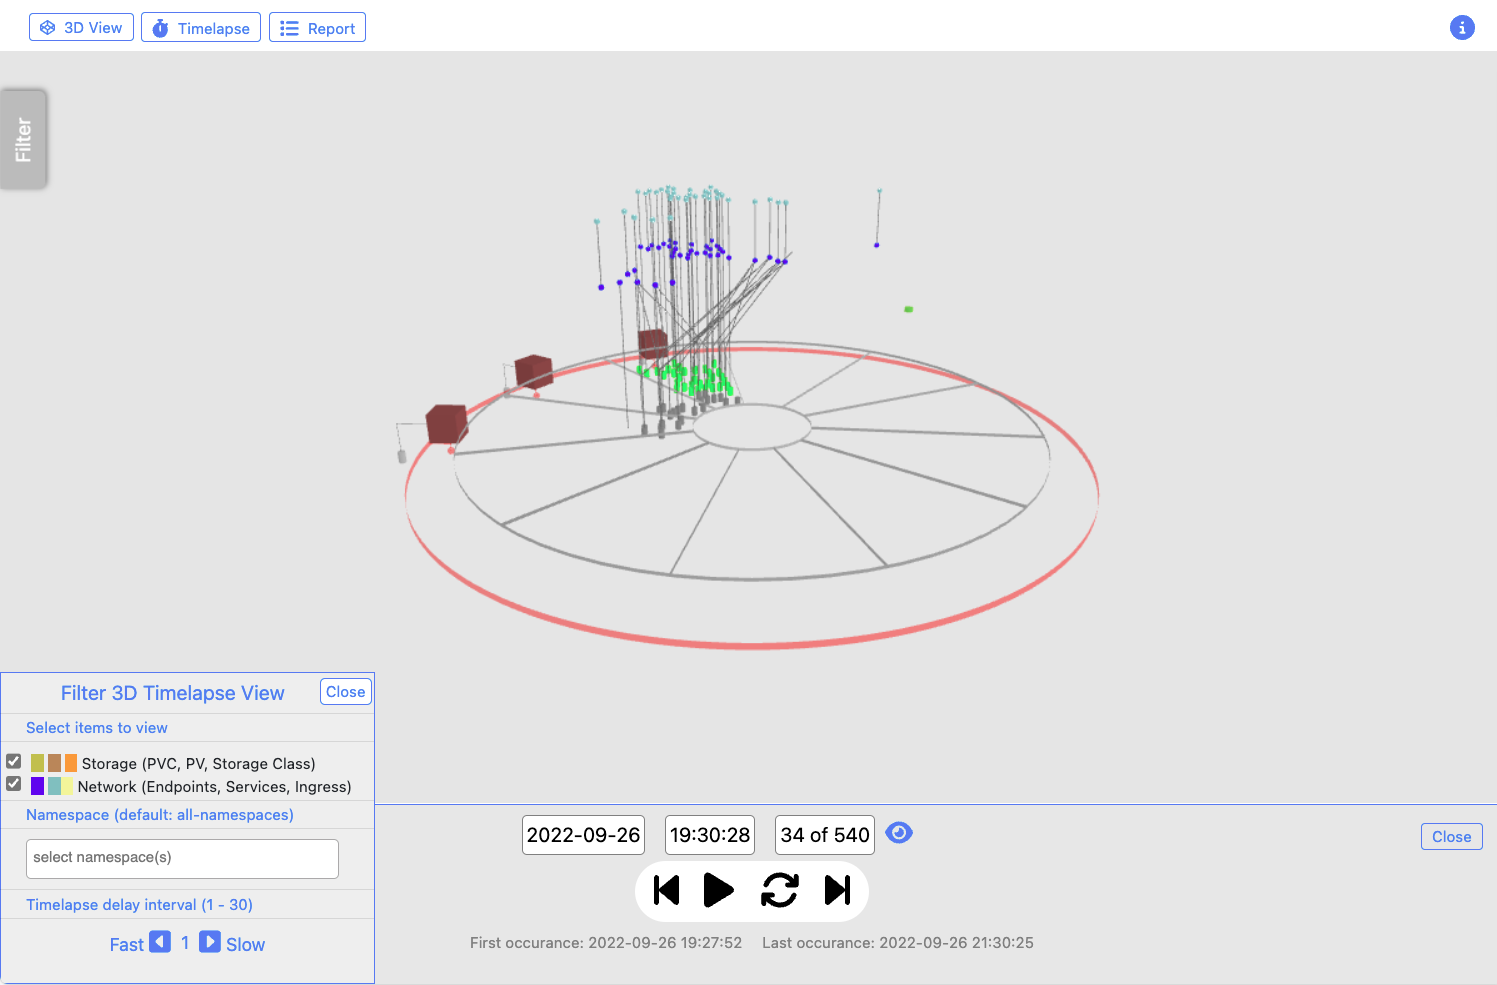
Timelapse view
The initial view of the timelapse will have no resources shown, only a circle that is divided into the number of nodes in the cluster. When started the first recorded change is shown. The next change is then shown and so on. The speed of displaying the changes is controlled by the Timelapse delay interval located in the filter slide-out for the timelapse.
A difference between the Timelapse view and the default view is all Completed Pods, shown in blue, will appear for a period and be shown only while the Pod is active. Thus, a blue Pod will appear for a short period of time and then be hidden from view.
While the Timelapse is running or when paused the view can still be rotated, zoomed, etc. Clicking on resources does not open the properties slide-out.
Timelapse controls and filter
The controls and filter are shown below. To start the automatic timelapse view press the start button (black triangle). The showing of changes in the cluster will start to appear. Once the start button is pressed the triangle will switch to a 'pause' button.
Press the pause button at any time to pause the auto play.
The filter slide-out provides the ability to control showing of the Network or Storage groups of resources, selection of a Namespace, and the duration of the interval.
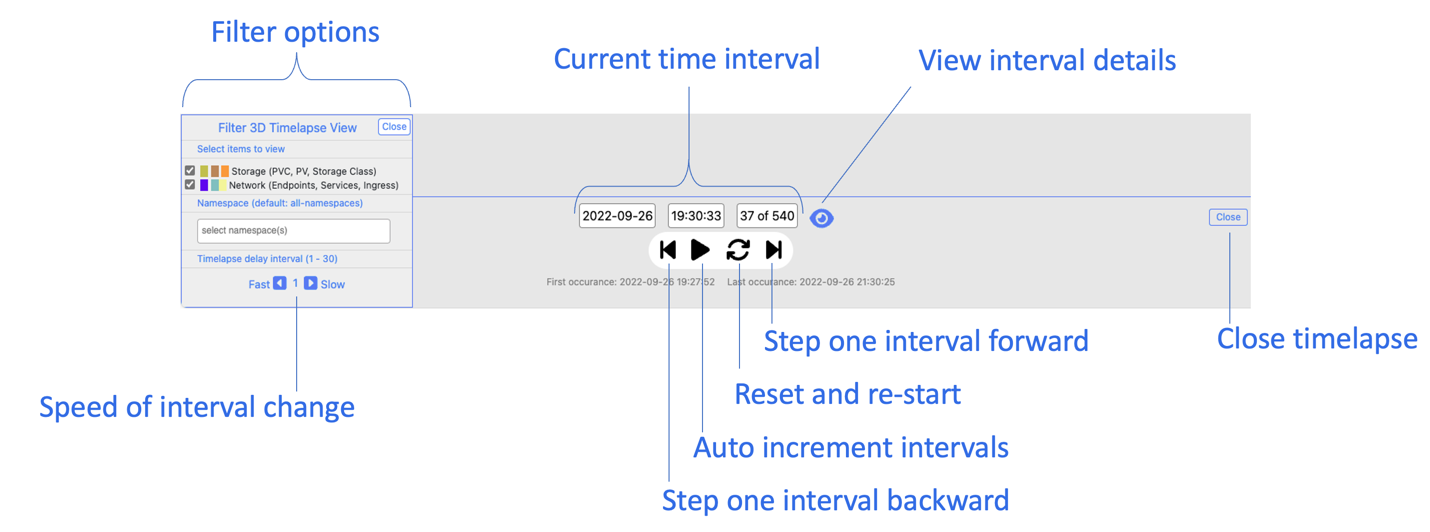
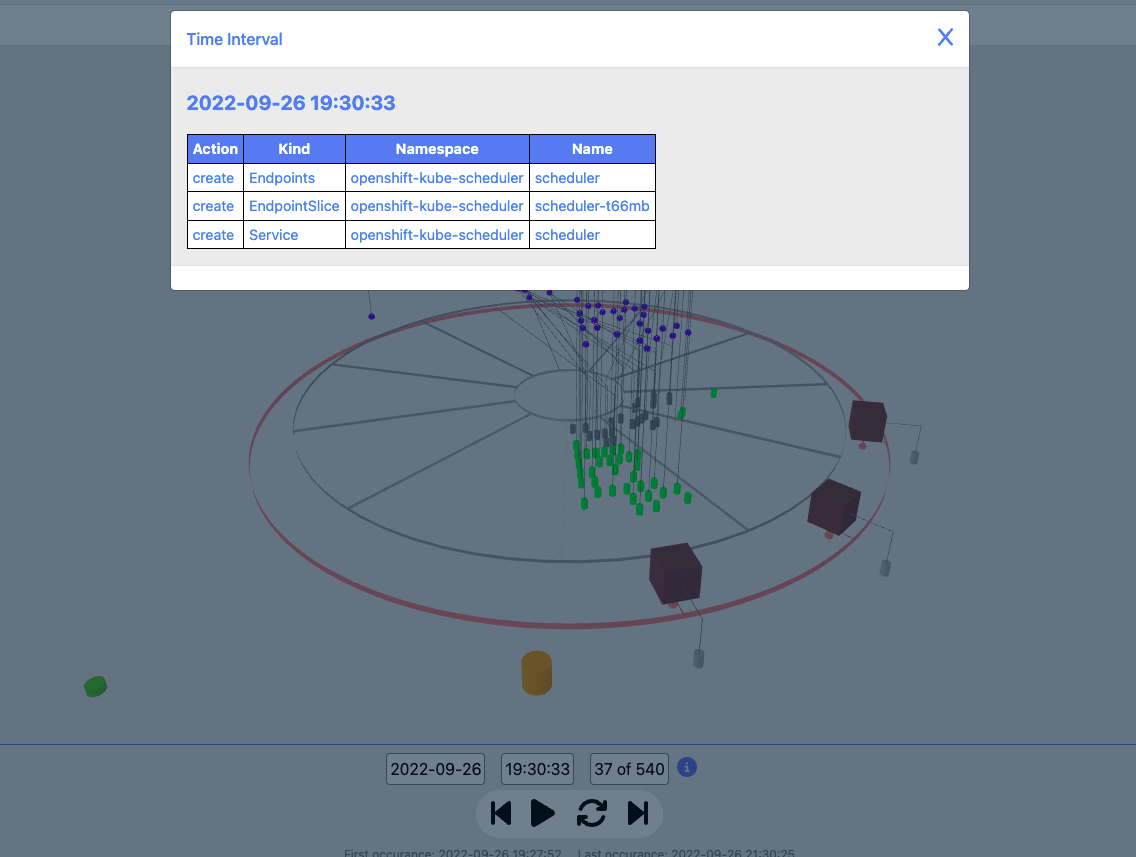
Interval detail view
Once the auto display is paused the detail changes for the currently displayed time interval can be viewed by pressing the blue eye icon. Pressing this will display all changes in the current interval in a tabular form.
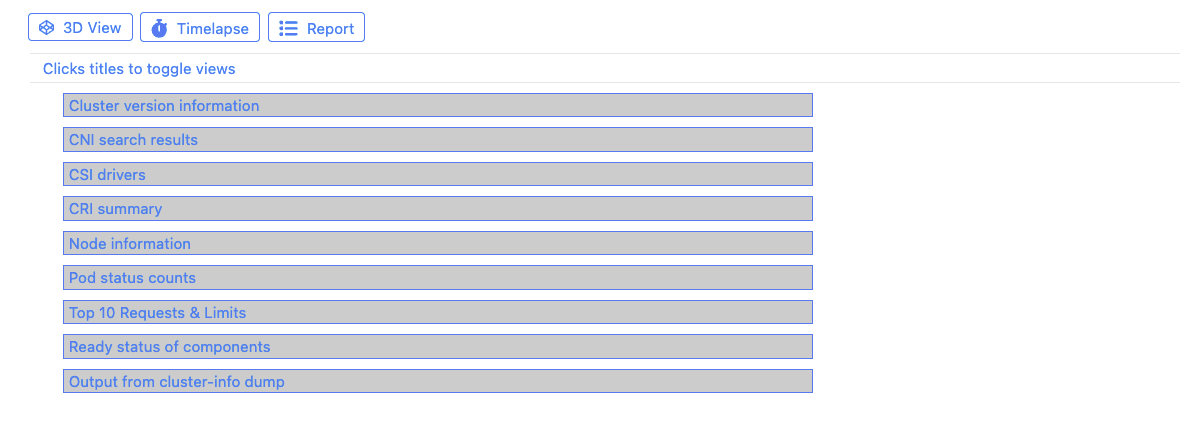
Report button
In the upper portion of this tab is a button labeled Report. When clicked this button will clear the 3D view and open a view with categories of cluster information for the selected snapshot. Click a category title and the view will expand to present the associated information. Clicking the category title again will toggle the view data.
Drilling down within the associated information is supported when approriate.